UX in UR
UX is fundamentally user-based, so it is imperative to listen to your users through research. Good UX requires good data.

UI Testing
This time, I got to experience creating a whole study with two other researchers from start to finish. I was in charge of the UI section.
Fellow Researchers: Carter Hoke and Ethan Volonte
Methodology
Convenience sample of 14
Participants were given, and signed, a consent form
Testing was done simultaneously on 3 machines in an open lab
Players were given a brief verbal tutorial before playing
Participants filled out a 30-question survey covering level design, UI, and NPC interaction
Findings
All participants found the chat box to be readable
Participants found chat response time to be fast
4 participants were unaware of the chatlog
About half of the participants did not know where the keyword menu was
Skills
Data collection
Data analysis
Data presentation
Communication
Tools
Excel
Microsoft Forms
Word
Unreal
Limitations
Only one machine had headphones hooked up
The introduction and tutorials given varied between participants, leading to occasional researcher intervention
30 survey questions produce a high cognitive load

Takeaways: Research with a Team
While comparing my work with my teammates, I found that my questions should have been more standardized
Experienced creating one report document with 3 researchers and 3 topics, and how chaotic that can be
Navigated scheduling to ensure no one was blocking anyone else
Dark vs. Light Mode
Skills
Data coding
Data analysis
Study creation
Self driven
Tools
Tobi Eye Tacking
Excel
Unity
Canva
Methodology
Convenience sample of 10
Participants were given, and signed, a consent form
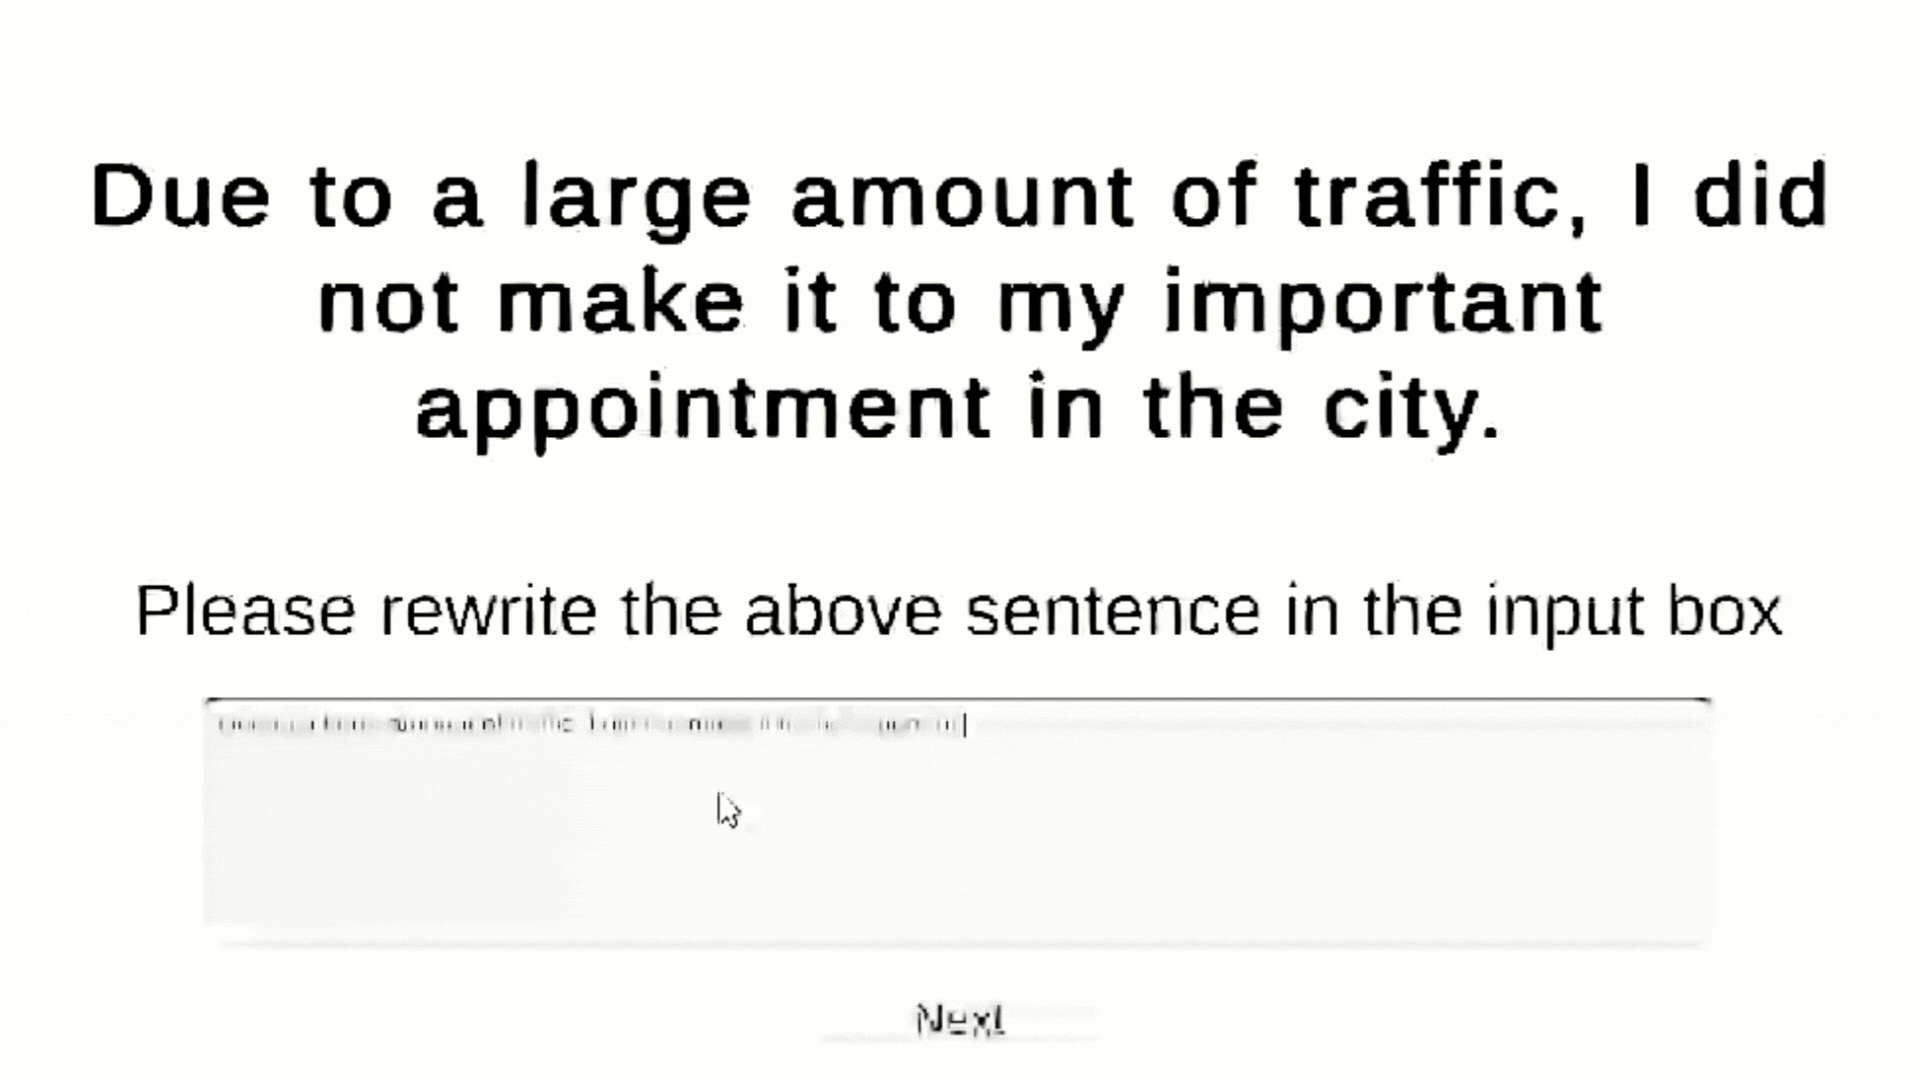
Participants were instructed to rewrite sentences to the best of their ability; 5 in dark, and 5 in light mode
Sentences were given in escalating difficulty based on academic reading test guidelines
One of life’s big questions… is light or dark mode better for reading and understanding information digitally?
Findings
Most participants started with a dark mode preference
Average spelling mistakes: light - 1.4, dark - 0.9
Average sentence fixations: light - 36.8, dark - 35
Overall, participants had an easier time understanding content in dark mode

Takeaways: Research Alone
I was the only one responsible for planning and creating the test and for how data was collected. This meant I got experience with pivoting halfway through
Experience with eye-tracking software, and having to learn it very fast
Ended up with lots of experience in coding data from video recordings
I got experience with creating a Unity prototype that became the test
Experience with creating a test based on academic guidelines
Storyboard Testing
Skills
Multidisciplinary communication
Data analysis
Data presentation
Tools
Excel
Word
Procreate
Methodology
Convenience sample of 9
Participants were given, and signed, a consent form
Participants were instructed to observe the storyboard first, then:
I asked a set of predetermined questions about their interpretation of the story
Participants then had the choice to leave or continue onto a different test
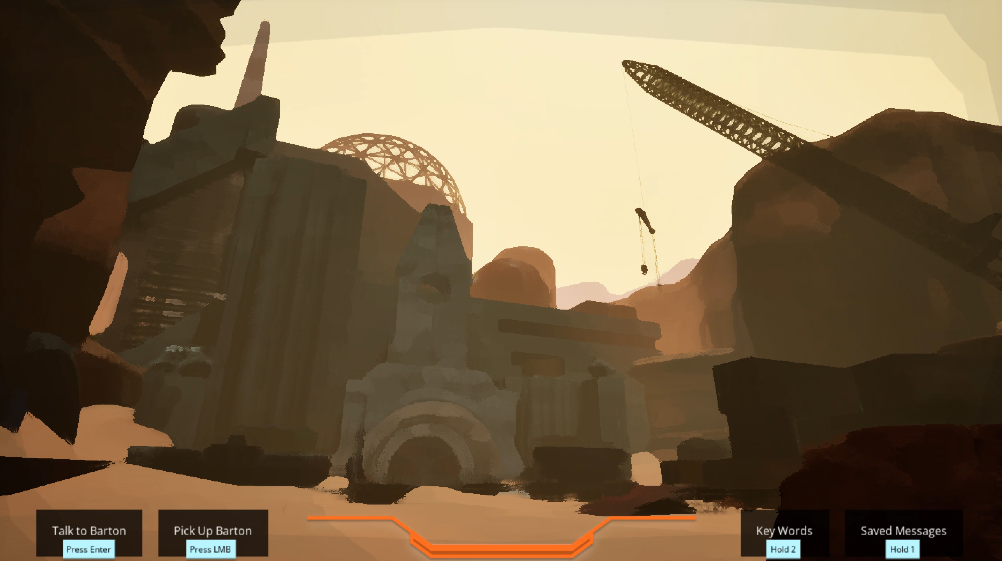
Part of being a researcher is working with other departments. For one of my teams, I was in charge of checking the clarity of our main narrative storyboard.
Assisted by my fellow researcher Ethan Volonte

Limitations
Limited and convenient participants
All participants were student game developers
Storyboard formatting constraints
Many distractions in the testing environment
Findings
Participants shared similar interpretations of the storyline and objectives
Most believed the goal was to repair the ship and leave the planet,
which is close but not fully accurate
Participants assumed that Barton starts out friendly, but not close to the player and that their relationship develops through the game
Takeaways: Research for Others
Learned how to adapt to getting materials for a study from another department
Got experience in presenting data to non-designers
Practice in being impartial, as well as not being involved in any solutions to problems that surface